Is change in the air?
by Desmond Von Teichman

Real estate cycles: reflections, irony, and change
For those of you who have followed this real estate space in Escarpment Magazine, you may recognize the byline. I used to be a regular contributor here but stepped back to broaden the horizon of opinions and topics. The fact that Clay Dolan, Publisher of Escarpment Magazine, asked me to write this piece at this time carries an element of irony, which I will demonstrate as we look in the rearview mirror.
The last piece I wrote was in March 2022. When I reread the last sentence of that article, I wonder why Clay asked me to write again at all! I concluded that article: “Demand remains strong, and supply remains short. Indicators are that we will see continued price appreciation as we make our way through 2022.”
Oops…
While the data suggested I was likely on the right track, there was something I had not factored in. Every market trend—good or bad, up or down—has an end. April 2022 marked the end of the upward seller’s market trend, and the numbers swung around… fast… as they tend to do in markets. Inflation became the word of the day. The Bank of Canada, seeing that low interest rates coupled with other stimulus were making everything, including housing, much more expensive, started to raise interest rates—quickly. Volume plummeted, the list-to-sale price ratio fell, days on market skyrocketed, and a strong seller’s market became a buyer’s market.
Fortunately, others had to write about that, and the local real estate market saw a slowdown that we haven’t experienced since 2008.
Now, the ironic part: I think we are on the cusp of a change again, and I have a second chance to get it right!
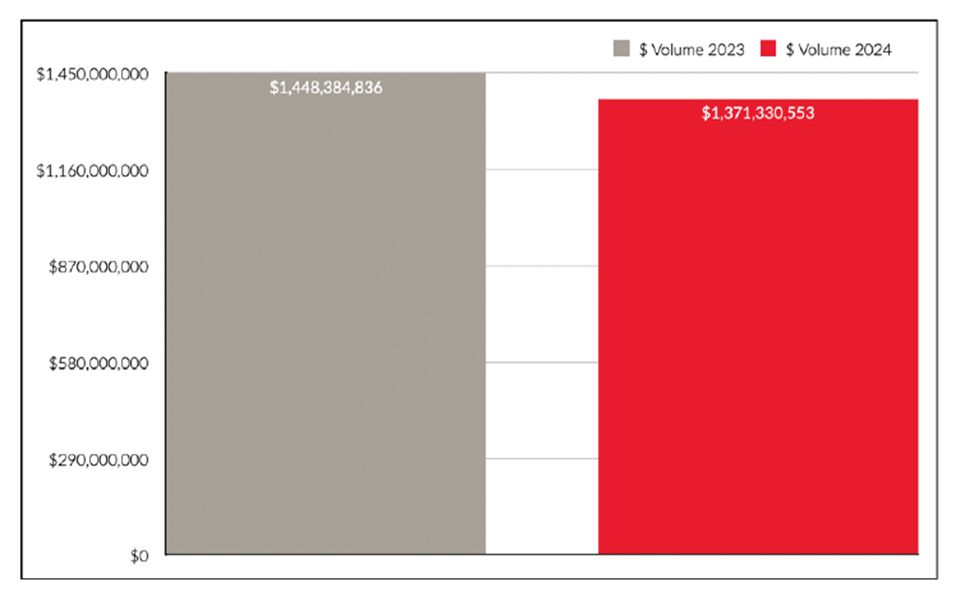
If I had been writing this in September 2024, at the end of the third quarter, I would have told you that most key factors were lagging behind 2023. Average sale price, dollar volume, unit volume—the works. And if you look at the running totals for the year, the end-of-November numbers (the most recent available at the time of writing) still bear that out. Year-to-date dollar volume is off by over 5% compared to last year. The sales-to-listing ratio is down 11%, average sale price is down 1.5%, and average days on market are up 17%.
I expected the first couple of Bank of Canada interest rate cuts would spur buyers into action. However, this did not come to pass. I had a hard time rationalizing this until an economist I follow pointed out that if the public anticipates further rate cuts (as we all did), the average consumer would likely take a “wait-and-see” approach until gaining greater confidence. It seems that is exactly what happened.
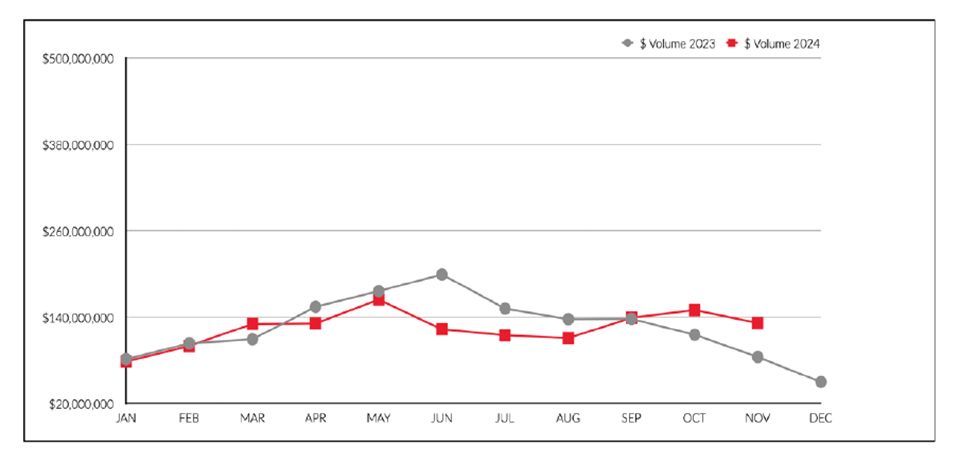
Then came the start of the fourth quarter, and we began to see numbers trend in a way we hadn’t in a while. Volume started to increase in October compared to the same period in 2023—cautious optimism. But one point on a chart is just a moment in time, not a trend. Then November came and went, and we saw the trend continue and expand. Monthly dollar volume of sales was up a whopping 56% compared to November 2023. Unit sales were up 18%, and the monthly average sale price rose 13%. While we don’t yet have final data for the year, we expect the fourth quarter of 2024 will be very encouraging compared to the previous year.
Dollar Volume Sales
Yearly Totals 2023 vs. 2024

Month vs. Month 2023 vs. 2024

Bank of Canada rates have come down significantly, and it looks like consumer confidence in the real estate sector may be proportionally on the rise. Following two significant half-point cuts, the Bank of Canada is signaling that future decreases will be more modest. Will this be the push that gets buyers off the fence? I don’t have a crystal ball, but the numbers suggest it might.
Some other interesting factors to consider: Year-to-date sales of properties priced over $2 million in Southern Georgian Bay stood at 69 when the brokerage published its September stats. By the end of November, just two months later, that number had ballooned to 114—a 40% increase in two months! One cornerstone of our marketing at Royal LePage Locations North is our online presence, and the data we see online tells an interesting story. We’ve observed a significant rise in incoming buyer lead volume through our electronic marketing and website leads. This is normally a precursor to increased transaction volume. In April 2022, we saw a significant decrease in such volume as the market turned, and lead volume has remained flat for the last two years. An increase is usually a good indicator of buyer interest.
So, as we close out 2024 and look at the market compared to 2023, we saw a market that continued a slow decline. It favoured buyers over sellers, with reduced dollar volume and unit sales from the previous year.
But I don’t think that’s the story. I think the story is a strong fourth quarter that could be the harbinger of a changing market in 2025 for Southern Georgian Bay. It has started in the higher end of the market, and anecdotal buyer interest is on the rise.
Last year, a friend bought a house, and I bet him a bottle of good scotch that by the end of 2024, the market would reflect the strength of his purchase. Over the holidays, I had to admit he’d be enjoying a nice bottle on me in January. However, I did offer him a double or nothing for 2025. He declined (coward).
I’ll conclude by borrowing from the ending of my March 2022 article, with a few key changes:
It was: “Demand remains strong, and supply remains short. Indicators are that we will see continued price appreciation as we make our way through 2022.” It shall now be: “In my opinion, demand in 2025 will be on the rise and start to absorb existing supply. Indicators are that we will see continued price appreciation as we make our way through 2025.”
Fingers crossed! E


